
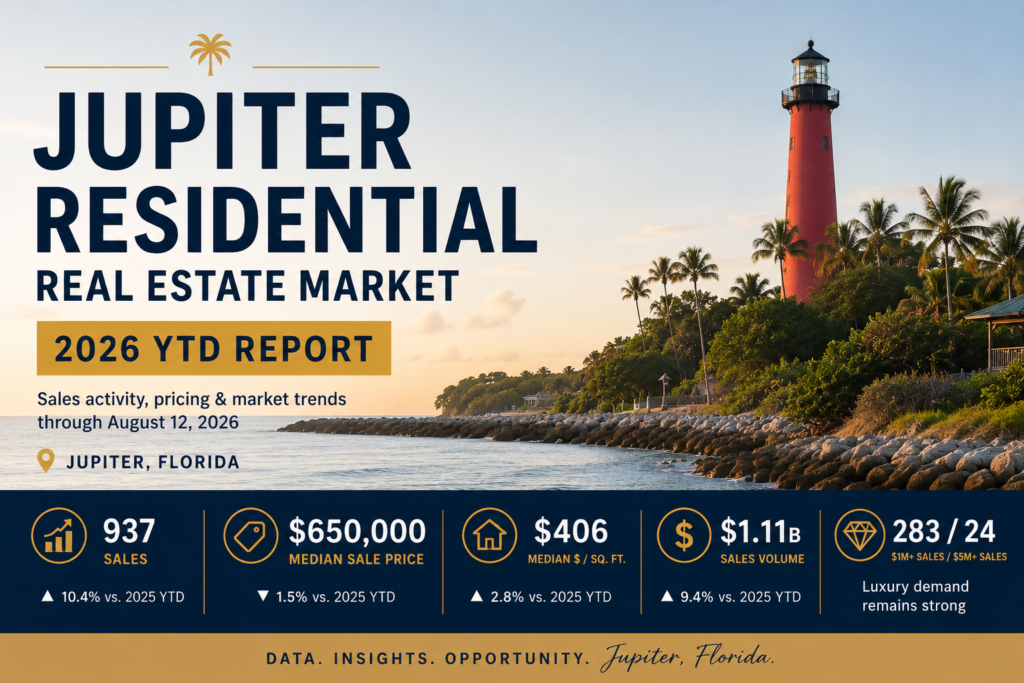
Residential sales through August 12, 2026
Jupiter’s residential real estate market is showing renewed transaction activity in 2026, while home values have remained remarkably resilient.
Through August 12, our analysis identified 937 qualifying residential sales totaling approximately $1.11 billion.
That compares with 849 transactions during the same January 1–August 12 period in 2025.
The result is a market where more homes are changing hands, overall pricing remains relatively stable, and values on a price-per-square-foot basis are actually running ahead of last year.
2026 Jupiter Residential Market at a Glance
- 937 qualifying residential sales
- $1.11 billion in total recorded sales volume
- $650,000 median sale price
- $406 median price per square foot
- +10.4% increase in sales activity vs. 2025 YTD
- 283 sales of $1 million or more
- 24 sales of $5 million or more
Perhaps the most important takeaway is that increased activity has not required a significant reset in home values.
The median sale price is only modestly below 2025, while the median price paid per square foot has moved higher.
More homes are trading, while Jupiter property values continue to demonstrate resilience.
Residential Sales Activity Is Up 10.4%
Through August 12, 2026, Jupiter recorded 937 qualifying residential transactions, compared with 849 during the same period last year.
That’s an increase of approximately 10.4% year over year.
The improvement becomes even more interesting when viewed against the last several years.
| Year | YTD Sales | Sales Volume | Median Sale | Median $/SF |
|---|---|---|---|---|
| 2021 | 1,547 | $1.19B | $438,000 | $279 |
| 2022 | 1,102 | $965.9M | $570,000 | $366 |
| 2023 | 870 | $974.6M | $635,000 | $390 |
| 2024 | 811 | $819.7M | $640,000 | $398 |
| 2025 | 849 | $1.01B | $660,000 | $395 |
| 2026 | 937 | $1.11B | $650,000 | $406 |
Each year represents the comparable January 1–August 12 period.
Transaction activity remains well below the extraordinary pace of 2021 and 2022, but 2026 has now moved clearly ahead of both 2023, 2024 and 2025.
That suggests Jupiter’s residential market is becoming more liquid again after several years of reduced turnover.
Jupiter’s Median Home Price Remains Stable
The median residential sale price through August 12 stands at approximately $650,000.
That compares with $660,000 during the same period of 2025, a decline of only about 1.5%.
In practical terms, Jupiter’s headline residential pricing has been largely stable year over year.
This is particularly notable considering transaction volume has increased by more than 10%.
A market experiencing significant downward pricing pressure would typically be expected to show a more pronounced deterioration in median pricing as transaction activity increased.
So far, the data doesn’t show that.
Instead, Jupiter appears to be absorbing increased sales activity while maintaining values relatively close to last year’s levels.
Price Per Square Foot Tells an Even Stronger Story
Median sale price alone doesn’t tell the entire story.
Jupiter’s median residential price per square foot increased from approximately $395 in 2025 to $406 in 2026.
That’s an increase of roughly 2.8%.
The longer-term trend is even more striking.
In the comparable period of 2021, Jupiter’s median residential sale was approximately $279 per square foot.
By 2026, that figure has reached approximately $406 per square foot.
That’s an increase of roughly 45% in five years.
While individual neighborhoods, property types and price points can perform very differently, the broader data indicates that buyers continue to place a substantial premium on Jupiter residential real estate.
2026 Residential Sales Volume Reaches $1.11 Billion
Qualifying residential transactions in the dataset represent approximately $1.11 billion in recorded sales volume through August 12.
That’s up from approximately $1.01 billion during the comparable 2025 period, an increase of roughly 9.4%.
What’s interesting is how closely that increase tracks the rise in transaction count.
Sales are up approximately 10.4%, while dollar volume is up approximately 9.4%.
That differs from Jupiter’s 2026 commercial market, where several very large transactions have caused dollar volume to rise substantially faster than transaction count.
On the residential side, the numbers indicate a broader increase in market activity rather than one driven exclusively by a handful of extraordinary sales.
Jupiter’s Luxury Market Remains a Major Force
Luxury real estate continues to represent a significant component of Jupiter’s residential market.
Through August 12, the dataset includes:
283 residential sales at $1 million or more.
That means approximately 30% of qualifying 2026 residential transactions have occurred at seven-figure prices.
At the very top of the market, there have also been:
24 residential sales at $5 million or more.
Jupiter’s ability to generate that level of ultra-luxury transaction activity reinforces its position as one of South Florida’s most significant high-end residential markets.
Communities and locations associated with Jupiter’s luxury segment—including waterfront properties, golf communities and estate neighborhoods—continue to attract substantial capital.
The strength of this segment also contributes to Jupiter’s unusually high overall residential sales volume relative to its number of transactions.
2026 Jupiter Residential Sales by Month
Activity has varied considerably throughout the year.
| Month | Sales | Sales Volume | Median Sale | Median $/SF |
|---|---|---|---|---|
| January | 98 | $116.6M | $692,500 | $447 |
| February | 107 | $145.2M | $650,000 | $423 |
| March | 145 | $189.5M | $640,800 | $407 |
| April | 151 | $135.5M | $585,000 | $389 |
| May | 147 | $147.1M | $630,000 | $405 |
| June | 129 | $149.0M | $655,000 | $386 |
| July | 142 | $211.2M | $750,863 | $431 |
| August* | 18 | $15.6M | $805,000 | $420 |
August figures include recorded sales only through August 12, 2026 and should not be compared with complete months.
The monthly data highlights an important development.
After the median sale price fell to approximately $585,000 in April, pricing strengthened through the early summer.
July was particularly notable.
The month produced 142 qualifying sales totaling approximately $211.2 million, with a median transaction price of roughly $751,000 and median pricing of approximately $431 per square foot.
That made July the strongest complete month of 2026 by total dollar volume in the analyzed dataset.
The Market Has Changed Dramatically Since 2021
Looking at transaction count alone can create a misleading impression of Jupiter’s longer-term residential market.
In the comparable period of 2021, there were 1,547 qualifying residential transactions—roughly 65% more than in 2026.
But the median sale price at the time was only $438,000.
Today it is approximately $650,000.
Median price per square foot has moved from approximately $279 to $406.
So although fewer homes are changing hands than during the extraordinary post-pandemic market of 2021, the properties that do trade are doing so at substantially higher values.
That distinction is important.
Jupiter isn’t returning to the transaction frenzy of 2021. Instead, it appears to be developing a healthier level of turnover at a much higher valuation base.
What Does This Mean for Jupiter Homeowners?
For existing homeowners, the 2026 data is generally encouraging.
Despite higher transaction activity, there has not been a significant decline in the market’s median sale price.
Meanwhile, price per square foot has increased.
That suggests Jupiter continues to benefit from many of the characteristics that have supported residential demand in recent years: limited desirable land, waterfront access, established neighborhoods, golf communities, proximity to beaches and boating, and strong demand for the broader northern Palm Beach County lifestyle.
However, this does not mean every Jupiter property has appreciated equally.
The market is increasingly property-specific.
Condition, location, renovations, waterfront access, community, lot characteristics, age, insurance considerations and pricing strategy can all create substantial differences between otherwise similar homes.
For sellers, accurately positioning a property against the most relevant recent comparable sales remains critical.
What Does This Mean for Buyers?
Buyers appear to have more opportunities than they did during the extremely constrained market of several years ago.
More transactions are occurring, which generally means more inventory is successfully reaching the closing table.
But the data also suggests buyers shouldn’t assume that increased activity automatically translates into sharply falling values.
The median sale price remains close to 2025 levels, while median price per square foot has actually increased.
That creates a market where buyers may have more choices and negotiating opportunities, but desirable Jupiter properties can still command premium pricing.
The result is a more nuanced environment than either a traditional buyer’s market or seller’s market.
Jupiter Residential Real Estate: 2026 YTD Outlook
Based on recorded sales through August 12, Jupiter’s residential real estate market appears to be entering the second half of 2026 with improving liquidity and resilient property values.
Sales activity is up approximately 10.4% year over year.
Total qualifying sales volume has exceeded $1.1 billion.
The median sale price remains near $650,000.
Median price per square foot has climbed to approximately $406.
And nearly one-third of qualifying transactions have occurred at $1 million or above.
Taken together, the data doesn’t point toward a market experiencing either another rapid price boom or a significant correction.
Instead, Jupiter appears to be moving toward a more active and balanced residential market while maintaining the substantial value gains established over the last several years.
For homeowners, buyers and investors, the headline for 2026 may be simple:
More homes are trading. Prices are holding. And buyers continue to pay a premium for quality Jupiter real estate.
About the Data
This analysis is based on the supplied Jupiter residential property sales dataset, with 2026 transactions analyzed through August 12, 2026.
Historical comparisons use the same January 1–August 12 period for each year to avoid comparing a partial 2026 year against complete prior calendar years.
For the primary residential analysis, transactions were required to have recorded building square footage and a sale price of at least $100,000. This helps remove nominal-value transfers and certain bulk, non-standard or otherwise non-comparable transactions that could materially distort residential market statistics.
Price-per-square-foot figures were calculated using the recorded sale price and building square footage contained in the dataset.
The figures should be viewed as a market-level analysis rather than a formal appraisal or MLS market report. Individual property values can vary substantially based on location, condition, property type, waterfront or golf access, renovations, lot characteristics and other factors not fully represented in the source data.
